MENU Polynomials & Beyond: A Precalculus Project : by - Mir Mahmood, Hasham Khawaja, & David Asis
Definition

  Definition
Sketching Graphs
Standard Form
Quadratic Equation

  The Leading Coefficient Test
Intermediate Value Theorem

  Long Division
Division Algorithm
Synthetic Division
Remainder Theorem
Factor Theorem

  What is a Real Zero?
Descartes Rule
Rational Zero Test
Bounds : Upper & Lower


Polynomial Functions of a Higher Degree


So far, we have discussed polynomials of first and second degree. In the world of Calculus, there is a far more complicated set of polynomials, polynomials of higher degrees!

Polynomials of higher degrees are far more complicated than first or second degree polynomials because when it comes to graphing them, it becomes more difficult to determine and actually graph the polynomial. However, through certain tests and theorems, the graphing of polynomials of higher degrees becomes a much simpler task. In graphing polynomials, the difficulty comes in determining the behavior of the graph. Whether it has an increasing or decreasing manner, the number of curves, the number of
real zeros, and so forth are among the annoying aspects of polynomials of a higher degree.


Leading Coefficient Test


The Leading Coefficient Test is the test which enables you to discover thebehavior of the graph in terms of rising and falling. This test utilizes the leading coefficientand whether the degree is odd or even to determine the behavior of the curves. The test goes as follows:

  When the degree is odd:
A)
If the leading coefficient is positive ( greater than zero ), then the graph falls to the left and rises to the right.
B)
If the leading coefficient is negative ( less than zero ), then the graph rises to the left and falls to the right.


  When the degree is even:
A)
If the leading coefficient is positive ( greater than zero ), then the graph rises to the left
and rises to the right.
B)
If the leading coefficient is negative ( less than zero ), then the graph falls to the left
and falls to the right.

By memorizing and understanding the rules of this test, you can determine a rough idea of how the graph must look, and as a result, you can lower your percent of error when is comes to graphing the polynomial. An aid to memorizing these rules is to use common examples to go with every type of function. For 
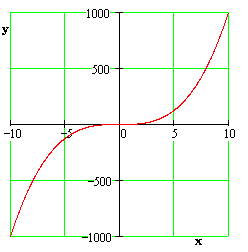
example, an odd degree polynomial with a positive coefficient can be "F of x equals x cubed".
You should know that that particular function falls to the left and rises to the right, which in turn corresponds to the rule. Continue to use other common examples to correspond to the test and you should have no problem in determining the behavior of the graph.

Intermediate Value Theorem :


Another important aspect of graphing polynomials of a higher degree is finding the real zeros of the function. When you are simply trying to get a rough idea of how a graph is going to look like, it is important to use and understand the Intermediate Value Theorem. This theorem gives you an estimate of where a root of the function exists. The definition of this particular theorem is a rather confusing and hard to comprehend, and because this web site is created with the idea of being user friendly, a much simpler approach will be taken in explaining the concept.

A real zero exists in a graph when there is an x intercept. Keeping this idea in mind, the theorem states that if point "A" and point "B" are two points on a graph where point "A" is less than "B" , there exists a point "C" between them. Point "C" is a real zero if and only if when substituting the value of "A" in the function it produces a negative answer (y value below the x axis), where as point "B" produces a positive answer( y value above the x axis). If one point is below and the other point is above the x axis, it is understood that at one point, the graph must pass the x axis, being a real zero. The rule stands true for every time a point "A" is less than a point "B" and the products of the values when plugged in produce differing signs.
Although this theorem does not give exact coordinates of the real zeros of a function, if gives a good estimation of where the roots of that graph are. If used in conjunction with the leading coefficient test, you can have a pretty close replication to the actual graph at hand.


Puzzle |Ti-82 | Games | Online Quiz | Credits